Lightning Football - Defensive Team Records

EASTVIEW LIGHTNING FOOTBALL

DEFENSIVE TEAM RECORDS 

RUSHING RECORDS


Lowest Overall Per Game Rushing Avg - Season

  1. 70.15                      2007
  2. 87.15                      2002
  3. 110.5                      2006
  4. 116.2                      2003
  5. 116.3                      2008
  6. 129.8                      2001
  7. 134.5                      1999
  8. 138.7                      2000
  9. 148.6                      2010
  10. 150.8                      2009


Lowest Rushing Avg per Attempt - Season

  1. 2.52                        2007
  2. 2.78                        2002
  3. 3.28                        2003
  4. 3.44                        2006
  5. 3.50                        2008      
  6. 3.69                        2000
  7. 3.72                        2001
  8. 3.77                        2010
  9. 3.86                        1999
  10. 4.15                        2004


Fewest Rushing Yards Allowed - Game

  1. -45          Century                 2006
  2. -12          Lake South           2007
  3. -2            Apple Valley        2010
  4. 4              Prior Lake             2007
  5. 4              Apple Valley         2007
  6. 6              Eagan                    2006
  7. 16           Edina                     2006
  8. 16           Owatonna             2003
  9. 25           Owatonna             2005
  10. 32           Lakeville South    2009


Fewest Total Rushing Yards Allowed - Season

  1. 912         2007(70.15/game)
  2. 1105       2006 (110.5/game)
  3. 1133       2002 (87.15/game)
  4. 1162       2003 (116.2/game)
  5. 1168       2001 (129.78/game)
  6. 1279       2008 (116.3/game)
  7. 1345       1999 (134.5/game)
  8. 1526       2000 (138.73/game)
  9. 1635       2010 (148.6/game)
  10. 1659       2009 (150.8/game)


Most Fumbles Recovered – Game

1.     6              Jefferson               2009
2.     4              Edina                     2005
3.     3              Several Times


Most Fumbles Recovered – Season

1.     18           2009 (1.63/game)
2.     17           2006 (1.7/game)
3.    14            2004 (1.4/game)
14           2005 (1.1/game)
5.     12           2010 (1.1/game)
6.    11            2003 (1.1/game)
7.     10           2008 (0.9/game)
10           2000 (0.9/game)
10           1999 (1.0/game)


PASSING RECORDS


Lowest Completion % - Game

  1. 0%          Kennedy                2003
  2. 0%          White Bear Lake 2002
  3. 8%          Owatonna             2002
  4. 10%       Kennedy (Sect)    2010
  5. 11%        Lakeville               1997
  6. 17%        Chaska                  2003
    17%        Chaska                  2004
  1. 20%        Winona                  2000
  2. 23%        Burnsville              2008
  3. 25%        Several Times


Lowest Completion % - Season

  1. 43%                        2007
    43%                        1998
  1. 44%                        2001
    44%                        1997
  1. 45%                        2008
  2. 46%                        2006

46%                        1999

  1. 47%                        2004
  2. 48%                        00, 02, 05


Fewest Yards Per Attempt – Season

  1. 4.64                        2007
  2. 5.22                        2008
  3. 5.58                        2002
  4. 5.67                        2005
  5. 5.66                        1998
  6. 5.80                        2001
  7. 5.87                        1999
  8. 6.06                        2003
  9. 6.37                        2010
  10. 6.40                        2004      


Highest Interceptions Per Attempt – Season

  1. 13 INT in 131 Attempts    9.85%    2010
  2. 13 INT in 161 Attempts     8.07%    1998
  3. 16 INT in 204 Attempts     7.84%    2000
  4. 9 INT in 212 Attempts       7.44%    2009
  5. 19 INT in 282 Attempts     6.74%    2007
  6. 18 INT in 267 Attempts     6.74%    2002
  7. 7 INT in 154 Attempts       5.17%    2004
  8. 9 INT in 198 Attempts       4.54%    1999
  9. 10 INT in 222 Attempts     4.50%    2008
  10. 8 INT in 179 Attempts       4.47%    2003


Fewest Passing Yards – Game

  1. 0              Kennedy                  2003
  2. 0              White Bear              2002
  3. 4              Rosemount            2010
  4. 6              Eagan                      2007
  5. 8              Lakeville                  1997
  6. 9              Kennedy                  2004
  7. 11            Owatonna                2002
  8. 11            Mayo                       2002
  9. 20            Rosemount (Sect)    2008
  10. 24            Century                   1998


Fewest Average Passing Yards – Season

  1. 76.5         (841 yards in 11 games)        2010
  2. 91.1         (911 yards in 10 games)          1998       
  3. 98.6         (986 yards in 10 games)          2004  
  4. 100.6       (1308 yards in 13 games)        2007
  5. 103.1       (928 yards in 9 games)            1997
  6. 105.4       (1159 yards in 11 games)        2008       
  7. 108.5       (1085 yards in 10 games)        2003       
  8. 116.3       (1163 yards in 10 games)        1999       
  9. 118.2       (1537 yards in 13 games)        2005       
  10. 123.7       (1113 yards in 9 games)          2001       


Most Interceptions – Game

  1. 5              Jefferson                 1998
  2. 4              Kennedy                 2010

4              Kennedy (Sect)      2010
4              Lakeville                  2000
5.     3              Several Times


Most Interceptions – Season

  1. 19            2007        (1.46/game)
  2. 18            2002        (1.38/game)
  3. 16            2000        (1.45/game)
  4. 13            1998        (1.30/game)
  5.         2010        (1.18/game)
  6. 10            2005        (.77/game)      
  7.  2008        (.90/game)
  8. 9              2006        (.90/game)
    9              1999        (.90/game)
    9              2009        (.82/game)

TEAM TOTAL DEFENSE RECORDS


Fewest Total Yards Allowed - Game

  1. 42            Apple Valley           2007
  2. 47            Apple Valley          2010
  3. 49            Eagan                      2007
  4. 54            Lake South              2007
  5. 64            Eagan                      2007
  6. 73            Lakeville North     2010
  7. 74            Burnsville                2005
  8. 77            Apple Valley           2009
  9. 79            Kennedy                  2003
  10. 82            Apple Valley           2002       


Fewest Average Yards Per Game  – Season

  1. 170.8/game              2007
  2. 201.7/game              2002
  3. 221.6/game              2008
  4. 224.6/game              2003
  5. 225.1/game             2010
  6. 250.8/game              1999
  7. 253.4/game              2001
  8. 258.7/game              2006
  9. 260.8/game              2000
  10. 273.8/game              2004


Fewest Yards Allowed Per Play – Season

  1. 3.45                         2007
  2. 3.89                         2002
  3. 4.15                         2008
  4. 4.21                         2003
  5. 4.37                         2010
  6. 4.51                         2001
  7. 4.59                         1999
  8. 4.64                         2000
  9. 4.75                         2004
  10. 4.81                         1998


Fewest Points Allowed Per Game – Season

  1. 10.8/game                2002        (140 Points)
  2. 11.2/game                2007        (146 Points)
  3. 14.8/game               2010        (163 Points)
  4. 14.9/game                1999        (149 Points)
  5. 15.1/game                2001        (136 Points)
  6. 15.2/game                2000        (167 Points)
  7. 16.0/game                2008        (176 Points)
  8. 16.4/game                2009        (180 Points)
  9. 16.7/game                2003        (167 Points)
  10. 18.4/game                1998        (184 Points)


Total Defensive Team Goals Attained – Season

  1. 87 of 130                 67%         2007
  2. 75 of 117                 64%         2002
  3. 67 of 110                 61%         2008
  4. 58 of 110                 58%        2010
  5. 52 of 90                   58%         2000
  6. 52 of 90                   58%         1999
  7. 47 of 90                   52%         1998
  8. 46 of 90                   51%         2006
  9. 54 of 110                 49%         2009
  10. 41 of 90                   45%         2003


Eastview Lightning Football
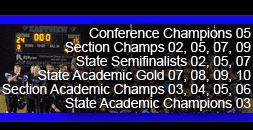
Conference Champions (2005), Section Champions (2002, 2005, 2007, 2009), State Semifinalists (2002, 2005, 2007), Section Academic Champions (2003, 2004, 2005, 2006), State Academic Champions (2003), State Academic Gold Award (2007, 2008, 2009, 2010)
Contact Coach Sherwin: kelly.sherwin@district196.org